Introduction
In this article, we’ll explore how to set up a complete DevSecOps environment on a local machine. This environment will enable to test and experiment with various DevSecOps practices that are essential for the modern development of secure applications.
Why a local DevSecOps environment ?
A local environment offers a number of advantages :
- Risk-free experimentation
- Speed of development and testing
- Configurations can be tested before being deployed in production
- Practical learning of DevSecOps tools and practices
Prerequisites
Recommended hardware configuration
- CPU : minimun 4 cores
- RAM : minimum 16 GB
- Disk space : minimum 50 GB free
- Operating system : Linux (Ubuntu/Debian recommended)
Required software
- Git
- Docker
- Docker Compose
- Administrator access (sudo)
Step-by-step installation
- Preparating system
Let’s start by updating the system and installing the necessary prerequisites :
sudo apt update && sudo apt upgrade -y
sudo apt install -y apt-transport-https ca-certificates curl software-properties-common git
2. Installing Docker and Docker Compose
curl -fsSL https://download.docker.com/linux/ubuntu/gpg | sudo apt-key add -
sudo add-apt-repository "deb [arch=amd64] https://download.docker.com/linux/ubuntu $(lsb_release -cs) stable"

sudo apt update
sudo apt install -y docker-ce docker-ce-cli containerd.io

sudo curl -L "https://github.com/docker/compose/releases/latest/download/docker-compose-$(uname -s)-$(uname -m)" -o /usr/local/bin/docker-compose
sudo chmod +x /usr/local/bin/docker-compose

sudo usermod -aG docker $USER

sudo systemctl enable docker
sudo systemctl start docker
3. Creating the project structure
mkdir -p devsecops-env/{jenkins,sonarqube,zap,monitoring,gitleaks,trivy}
cd devsecops-env
First, let’s create the network manually so that our containers (grafana, prometheus, sonarqube and jenkins) can be visible to each other on the same network.
docker network create monitoring
4. Service configuration
4.1. Jenkins (CI/CD)
Create a jenkins/docker-compose.yml file :
version: '3'
services:
  jenkins:
    image: jenkins/jenkins:lts
    container_name: jenkins
    ports:
      - "8080:8080"
      - "50000:50000"
    volumes:
      - jenkins_home:/var/jenkins_home
      - /var/run/docker.sock:/var/run/docker.sock
    environment:
      - JAVA_OPTS=-Djenkins.install.runSetupWizard=true
    networks:
      - monitoring
    restart: unless-stopped

volumes:
  jenkins_home:

networks:
  monitoring:
    external: true
4.2. SonarQube (Code analysis)
Create a sonarqube/docker-composer.yaml file :
version: '3'
services:
  sonarqube:
    image: sonarqube:latest
    container_name: sonarqube
    ports:
      - "9000:9000"
      - "8081:8081"
    volumes:
      - sonarqube_data:/opt/sonarqube/data
      - sonarqube_extensions:/opt/sonarqube/extensions
      - sonarqube_logs:/opt/sonarqube/logs
      - ./jmx_exporter:/opt/jmx_exporter
    environment:
      - SONAR_JDBC_URL=jdbc:postgresql://db:5432/sonar
      - SONAR_JDBC_USERNAME=sonar
      - SONAR_JDBC_PASSWORD=sonar
      - SONAR_WEB_JAVAADDITIONALOPTS=-javaagent:/opt/jmx_exporter/jmx_prometheus_javaagent.jar=8081:/opt/jmx_exporter/config.yaml
    depends_on:
      - db
    networks:
      - monitoring
    restart: unless-stopped
  db:
    image: postgres:12
    container_name: sonarqube_db
    environment:
      - POSTGRES_USER=sonar
      - POSTGRES_PASSWORD=sonar
      - POSTGRES_DB=sonar
    volumes:
      - postgresql:/var/lib/postgresql
      - postgresql_data:/var/lib/postgresql/data
    networks:
      - monitoring
    restart: unless-stopped

volumes:
  sonarqube_data:
  sonarqube_extensions:
  sonarqube_logs:
  postgresql:
  postgresql_data:

networks:
  monitoring:
    external: true
Before launching this configuration, you need to :
- Create the jmx_exporter folder and download the agent
mkdir jmx_exporter
wget https://repo1.maven.org/maven2/io/prometheus/jmx/jmx_prometheus_javaagent/0.19.0/jmx_prometheus_javaagent-0.19.0.jar -O jmx_exporter/jmx_prometheus_javaagent.jar
2. Create the configuration file jmx_exporter/config.yaml
---
lowercaseOutputName: true
lowercaseOutputLabelNames: true
rules:
  - pattern: ".*"
4.3. OWASP ZAP (Safety test)
Create a zap/docker-composer.yaml file :
version: '3'
services:
  zap:
    image: ghcr.io/zaproxy/zaproxy:stable
    container_name: owasp_zap
    command: zap.sh -daemon -host 0.0.0.0 -port 8090 -config api.addrs.addr.name=.* -config api.addrs.addr.regex=true -config api.key=changeme123
    ports:
      - "8090:8090"
    volumes:
      - zap_data:/zap/wrk/
    restart: unless-stopped

volumes:
  zap_data:
4.4. Trivy (Container vulnerability analysis)
Create a trivy/docker-composer.yaml file :
version: '3'
services:
  trivy:
    image: aquasec/trivy:latest
    container_name: trivy
    volumes:
      - trivy_cache:/root/.cache
      - /var/run/docker.sock:/var/run/docker.sock
    environment:
      - TRIVY_CACHE_DIR=/root/.cache/
      - GITHUB_TOKEN=${GITHUB_TOKEN}  # Optional : To avoid the limitation of the GitHub API
    command: server --listen 0.0.0.0:4954
    ports:
      - "4954:4954"
    restart: unless-stopped

volumes:
  trivy_cache:
To use Trivy directly from the command line
# Trivy installation
sudo apt-get install wget apt-transport-https gnupg lsb-release
wget -qO - https://aquasecurity.github.io/trivy-repo/deb/public.key | sudo apt-key add -
echo deb https://aquasecurity.github.io/trivy-repo/deb $(lsb_release -sc) main | sudo tee -a /etc/apt/sources.list.d/trivy.list
sudo apt-get update
sudo apt-get install trivy

# Examples of how Trivy is used
# Scan an image
trivy image nginx:latest

# Scanning an image with a JSON output format
trivy image -f json -o results.json nginx:latest

# Scanning an image with critical vulnerability filtering
trivy image --severity CRITICAL nginx:latest

# Scan a local project
trivy fs .
4.5. Monitoring (Prometheus + Grafana)
Create a monitoring/docker-composer.yaml file :
version: '3'
services:
  prometheus:
    image: prom/prometheus:latest
    container_name: prometheus
    ports:
      - "9090:9090"
    volumes:
      - ./prometheus.yml:/etc/prometheus/prometheus.yml
      - prometheus_data:/prometheus
    networks:
      - monitoring
    restart: unless-stopped

  grafana:
    image: grafana/grafana:latest
    container_name: grafana
    ports:
      - "3000:3000"
    volumes:
      - grafana_data:/var/lib/grafana
    environment:
      - GF_SECURITY_ADMIN_PASSWORD=admin
    depends_on:
      - prometheus
    networks:
      - monitoring
    restart: unless-stopped

volumes:
  prometheus_data:
  grafana_data:

networks:
  monitoring:
    external: true
Create a monitoring/prometheus.yml file :
global:
  scrape_interval: 15s

scrape_configs:
  - job_name: 'prometheus'
    static_configs:
      - targets: ['prometheus:9090']

  - job_name: 'jenkins'
    metrics_path: '/prometheus'
    static_configs:
      - targets: ['jenkins:8080']

  - job_name: 'sonarqube'
    static_configs:
      - targets: ['sonarqube:8081']
    basic_auth:
      username: 'admin'
      password: 'admin'
5. Service management script
#!/bin/bash
check_service() {
if [ $? -eq 0 ]; then
echo "$1 successfully launched"
else
echo "Error when starting $1"
exit 1
fi
}
start_services() {
echo "Starting services..."
cd jenkins
docker-compose up -d
check_service "Jenkins"
cd ../sonarqube
docker-compose up -d
check_service "SonarQube"
cd ../zap
docker-compose up -d
check_service "OWASP ZAP"
cd ../monitoring
docker-compose up -d
check_service "Monitoring Stack"
cd ..
echo "All services are started"
echo "
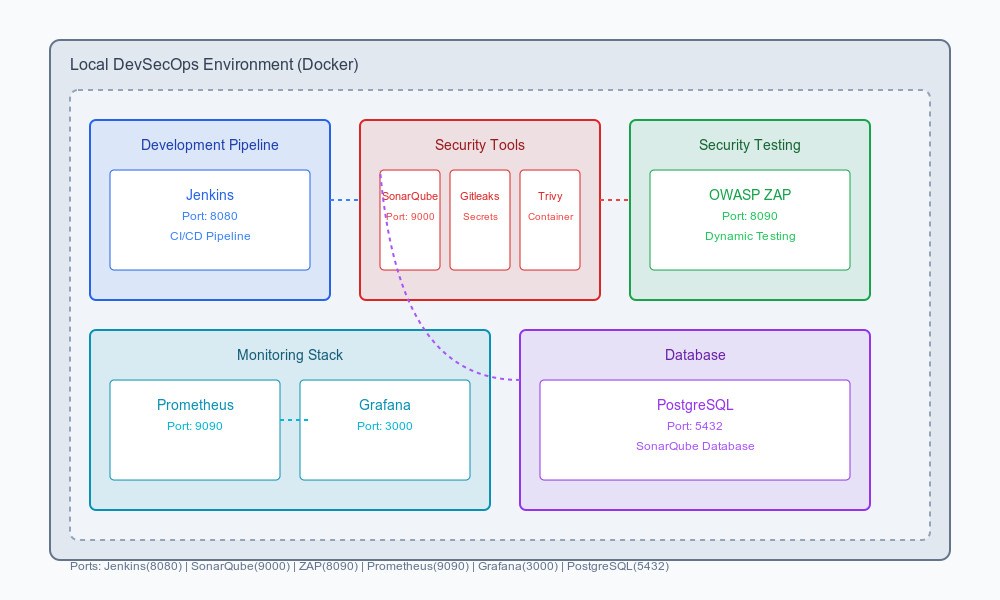
Services available :
- Jenkins: http://localhost:8080
- SonarQube: http://localhost:9000
- OWASP ZAP: http://localhost:8090
- Grafana: http://localhost:3000
- Prometheus: http://localhost:9090
- Trivy Server: http://localhost:4954
"
}
stop_services() {
echo "Stopping services..."
cd jenkins && docker-compose down
cd ../sonarqube && docker-compose down
cd ../zap && docker-compose down
cd ../trivy && docker-compose down
cd ../monitoring && docker-compose down
cd ..
echo "All services stopped"
}
case "$1" in
start)
start_services
;;
stop)
stop_services
;;
*)
echo "Usage: $0 {start|stop}"
exit 1
;;
esac
Make the script executable :
chmod +x manage-services.sh
Post-installation configuration
Jenkins
- Recover the initial password
docker exec jenkins cat /var/jenkins_home/secrets/initialAdminPassword
Installing the prometheus plugin for Jenkins
-
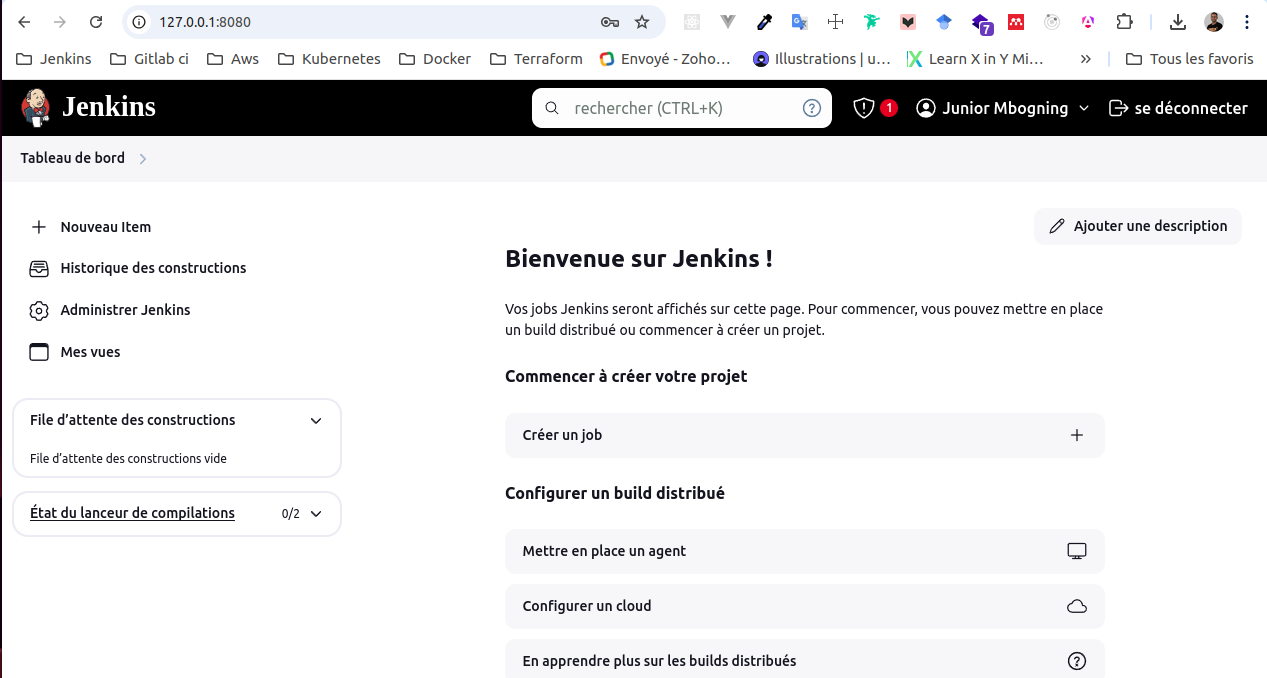
Go to http://127.0.0.1:8080 and follow the installation wizard
-
Installing the plugin :
- Go to ‘Manage Jenkins’ > ‘Plugins’ > ‘Available Plugins’.
- Search for ‘Prometheus metrics
- Install the plugin and restart Jenkins if necessary
3. Accès aux métriques : http://127.0.0.1:8080/prometheus/
SonarQube
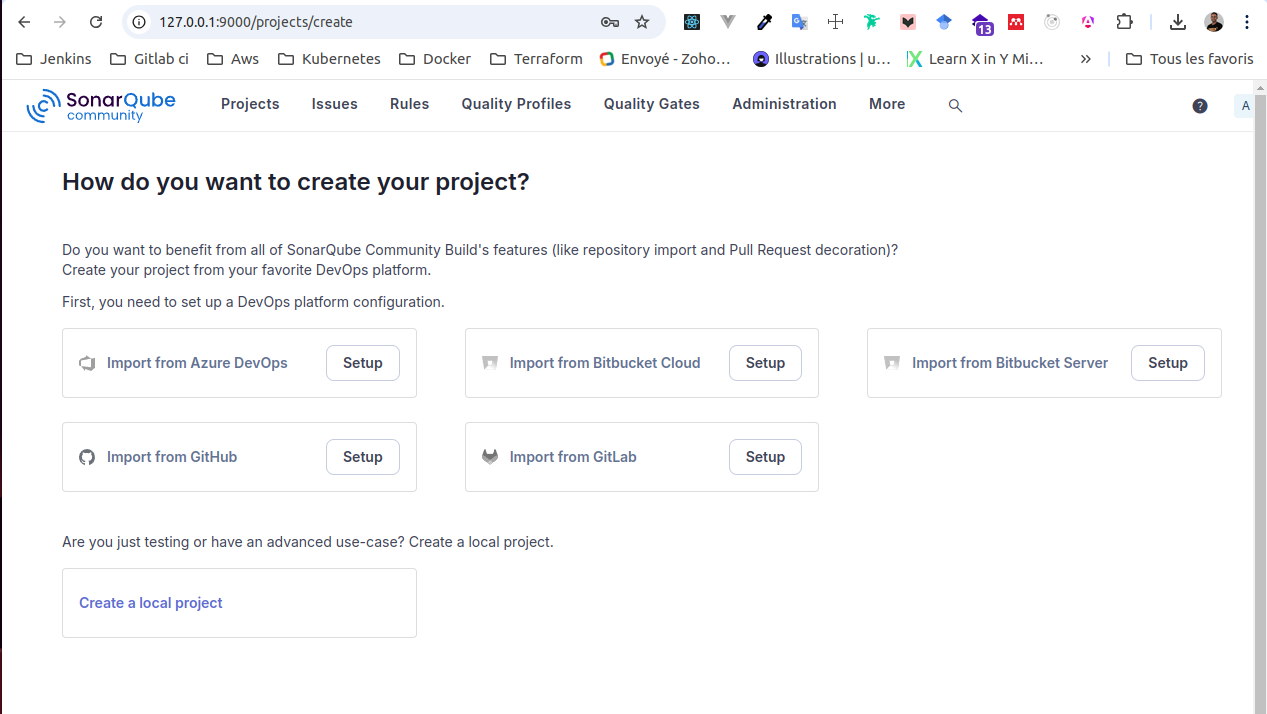
- Go to http:127.0.0.1:9000(default login : admin/admin)
- Change the admin password
- Create a new and generate an authentication token
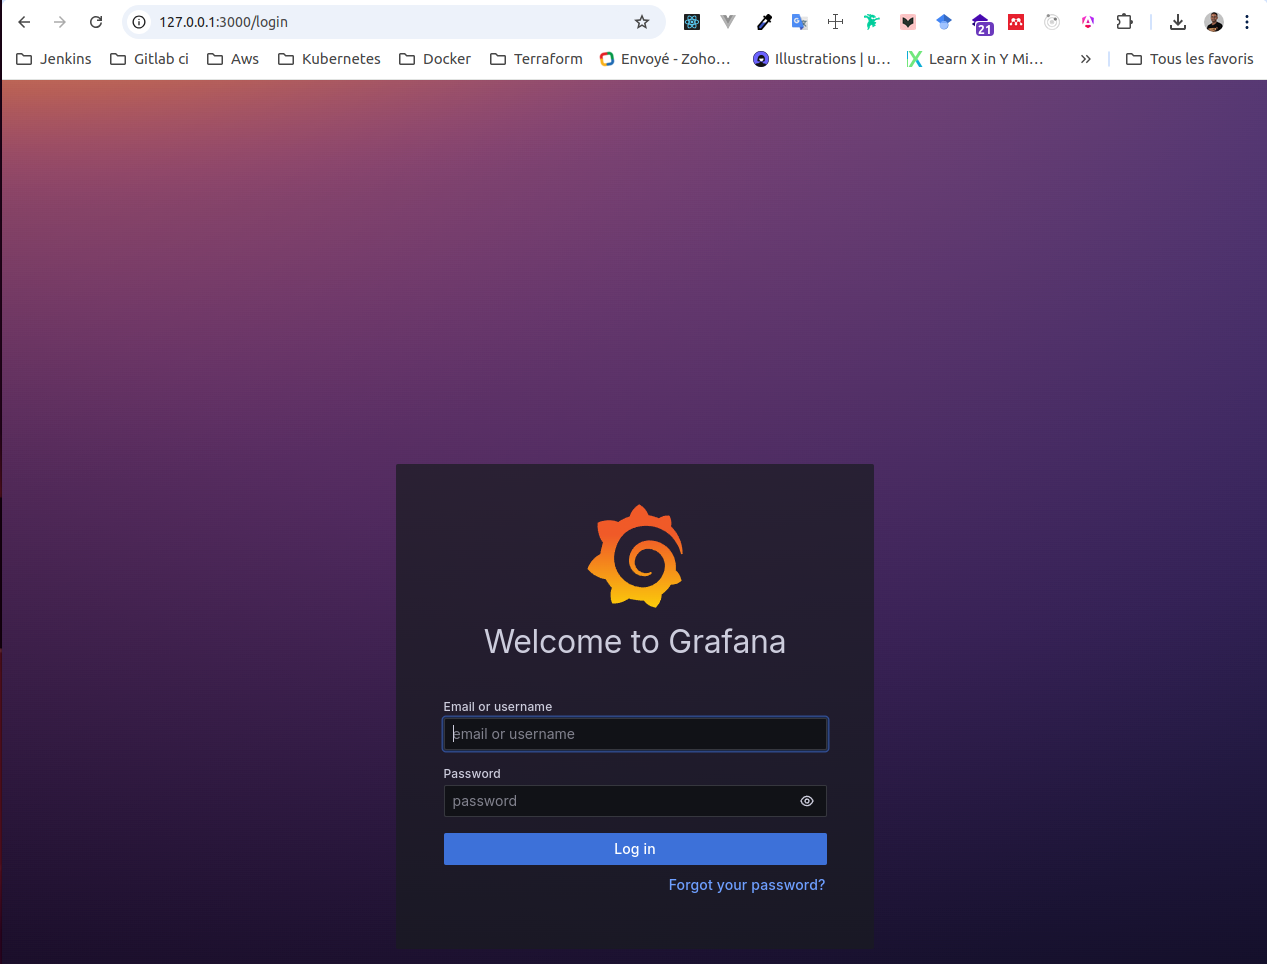
Grafana
- Go to http://127.0.0.1:3000(default login : admin/admin)
- Add prometheus as a datasource
- Import a preconfigured dashboards for jenkins and SonarQube
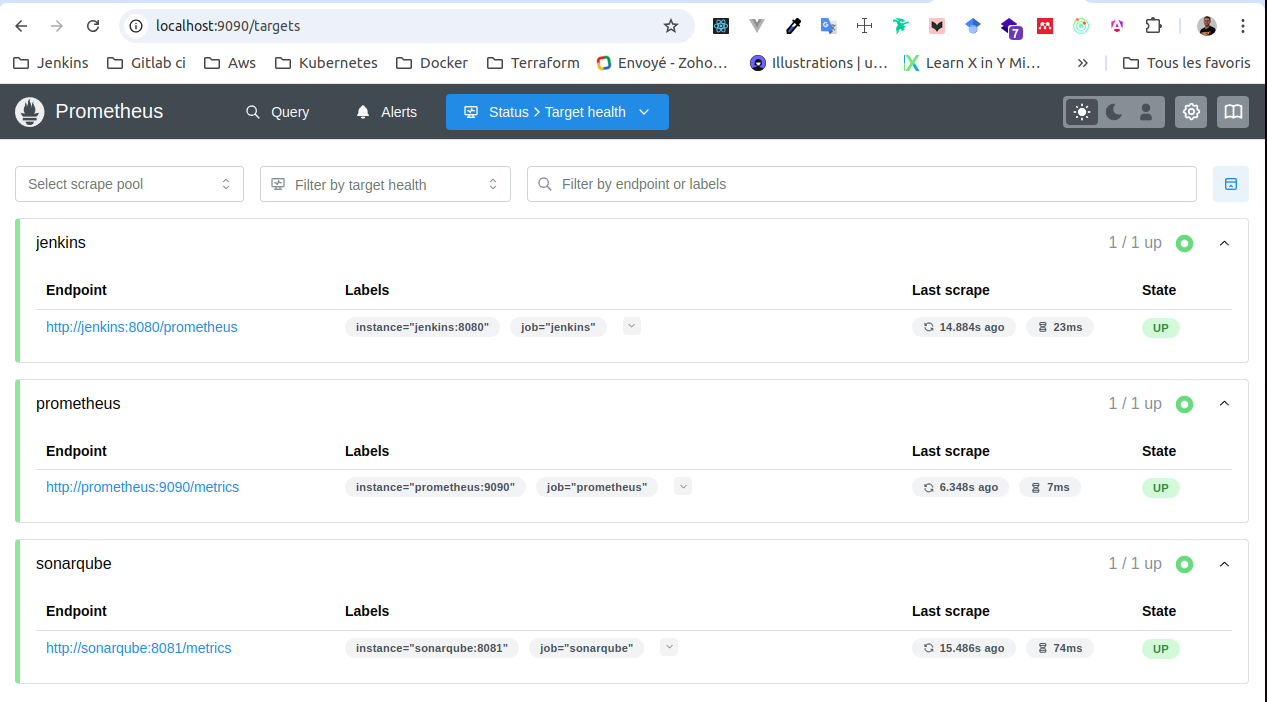
Prometheus
- Go to http://127.0.0.1:9090/target
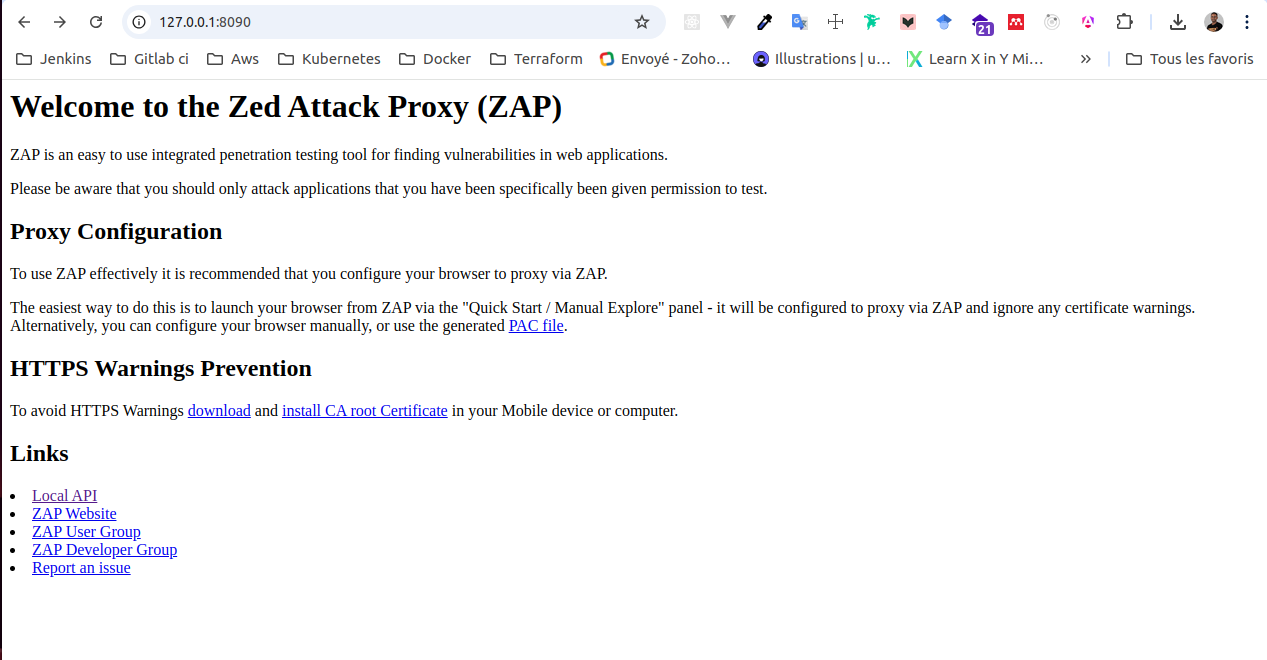
OWAPS ZAP
- Go to http://127.0.0.1:8090