
Mettre en place un cluster Kubernetes ne se résume pas à lancer quelques commandes jusqu’à voir des nœuds en état Ready. En contexte entreprise, on cherche surtout une base fiable et durable : un système correctement préparé, un runtime cohérent, un réseau maîtrisé, des accès limités, une observabilité en place, et une stratégie de sauvegarde réaliste.
Dans cet article, je déroule un déploiement complet sous Debian 12 (Bookworm) dans un environnement VirtualBox, avec un nœud maître et deux workers, Calico pour le réseau, puis Prometheus, Grafana et Loki pour la supervision. L’idée est simple : obtenir un cluster utilisable, que l’on peut exploiter et faire évoluer sereinement.
1. Architecture et prérequis
Architecture cible
L’architecture retenue est volontairement simple, mais elle reproduit bien les fondamentaux que l’on retrouve en entreprise : un plan de contrôle séparé des nœuds de charge et un réseau overlay robuste.
- 1 nœud maître
- 2 nœuds workers
- Réseau overlay Calico
- Système Debian 12 (Bookworm)
- Environnement VirtualBox
Configuration matérielle minimale recommandée
Pour éviter les instabilités dès le départ, voici des valeurs minimales raisonnables, surtout si vous installez ensuite la supervision et la collecte de logs.
Nœud maître
- CPU 2 vCPU minimum
- RAM 4 Go minimum
- Disque 50 Go minimum
Nœuds workers
- CPU 4 vCPU minimum
- RAM 8 Go minimum
- Disque 100 Go minimum
Configuration système initiale sur tous les nœuds
Avant d’installer Kubernetes, on prépare Debian correctement. Cette étape est souvent sous-estimée, alors qu’elle évite la majorité des problèmes classiques : dérive d’horloge, swap activé, modules réseau manquants, et paramètres noyau inadaptés.
Vous pouvez exécuter les commandes suivantes sur le nœud maître et sur les workers.
# Mise à jour initiale du système
sudo apt update && sudo apt upgrade -y
sudo apt install -y apt-transport-https ca-certificates curl gnupg lsb-release systemd-timesyncd

# Activation du service NTP
sudo systemctl enable systemd-timesyncd
sudo systemctl start systemd-timesyncd

# Désactivation du swap (obligatoire pour Kubernetes)
sudo swapoff -a
sudo sed -i '/ swap / s/^/#/' /etc/fstab

# Chargement des modules noyau nécessaires
cat <<EOF | sudo tee /etc/modules-load.d/k8s.conf
overlay
br_netfilter
EOF

sudo modprobe overlay
sudo modprobe br_netfilter

# Paramétrage du réseau pour Kubernetes
cat <<EOF | sudo tee /etc/sysctl.d/k8s.conf
net.bridge.bridge-nf-call-iptables  = 1
net.bridge.bridge-nf-call-ip6tables = 1
net.ipv4.ip_forward                 = 1
EOF

sudo sysctl --system
2. Installation des composants de base
Sur tous les nœuds, on commence par installer containerd, puis les composants Kubernetes. L’objectif est d’avoir un runtime stable et conforme aux attentes de kubelet. Le point important ici est l’activation du mode systemd pour la gestion des cgroups, ce qui évite des incohérences côté ressources.
Exécutez ces commandes sur le maître et sur les workers.
sudo apt install -y containerd

# Génération du fichier de configuration par défaut
sudo mkdir -p /etc/containerd
containerd config default | sudo tee /etc/containerd/config.toml

# Activation du mode Systemd pour gérer les cgroups
sudo sed -i 's/SystemdCgroup = false/SystemdCgroup = true/' /etc/containerd/config.toml
sudo systemctl restart containerd

# Ajout de la clé et du dépôt officiel Kubernetes
curl -fsSL https://pkgs.k8s.io/core:/stable:/v1.31/deb/Release.key | sudo gpg --dearmor -o /etc/apt/keyrings/kubernetes-apt-keyring.gpg

echo 'deb [signed-by=/etc/apt/keyrings/kubernetes-apt-keyring.gpg] https://pkgs.k8s.io/core:/stable:/v1.31/deb/ /' | sudo tee /etc/apt/sources.list.d/kubernetes.list

# Installation des paquets Kubernetes
sudo apt update
sudo apt install -y kubelet kubeadm kubectl
sudo apt-mark hold kubelet kubeadm kubectl
Le verrouillage des versions permet de garder un cluster cohérent. En entreprise, une montée de version se prépare et se teste, elle ne se fait pas “par surprise” via une mise à jour automatique.
3. Initialisation du cluster
Cette étape se fait sur le nœud maître. On initialise le cluster avec kubeadm, on configure l’accès kubectl pour l’utilisateur courant, puis on déploie Calico afin que les pods puissent communiquer entre eux.
sudo kubeadm init --pod-network-cidr=192.168.0.0/16 --control-plane-endpoint="MASTER_IP:6443" --upload-certs

# Configuration pour l’utilisateur non root
mkdir -p $HOME/.kube
sudo cp -i /etc/kubernetes/admin.conf $HOME/.kube/config
sudo chown $(id -u):$(id -g) $HOME/.kube/config

# Installation de Calico
kubectl create -f https://raw.githubusercontent.com/projectcalico/calico/v3.26.1/manifests/calico.yaml
L’ajout des workers se fait ensuite sur chaque nœud worker en utilisant la commande join affichée lors de l’initialisation du maître.
sudo kubeadm join MASTER_IP:6443 --token <token> --discovery-token-ca-cert-hash sha256:<hash>
4. Configuration post-installation
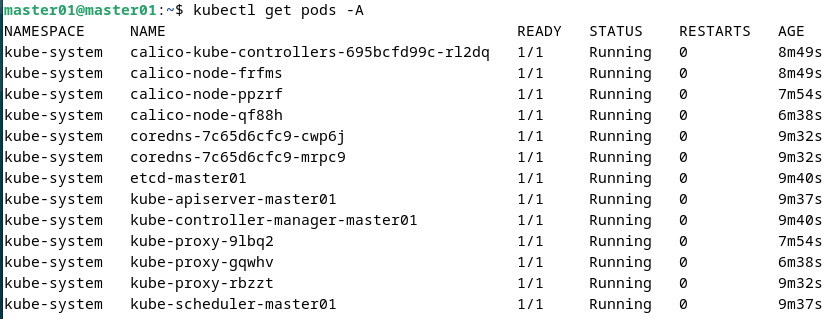
Une fois les nœuds joints, la première vérification à faire consiste à confirmer que les nœuds sont prêts et que les pods système sont bien démarrés. Si Calico n’est pas correctement en place, c’est souvent ici que cela se voit.
kubectl get nodes
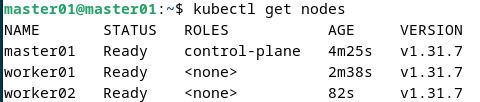
kubectl get pods -A
Pour un environnement de test, il est souvent pratique de disposer rapidement d’un stockage persistant. Le local-path-provisioner est simple et efficace en lab.
kubectl apply -f https://raw.githubusercontent.com/rancher/local-path-provisioner/master/deploy/local-path-storage.yaml
kubectl patch storageclass local-path -p '{"metadata": {"annotations":{"storageclass.kubernetes.io/is-default-class":"true"}}}'
5. Sécurisation du cluster
Dans un cluster d’entreprise, l’accès administrateur permanent est rarement une bonne idée. La première brique à mettre en place est donc un utilisateur limité, avec des droits précis et un périmètre clair. Ici, on utilise un certificat client et RBAC, puis on applique une politique réseau restrictive par défaut dans un namespace dédié.
Tout se fait sur le nœud maître.
# Génération de la clé et de la demande de certificat (CSR)
openssl genrsa -out mbogning.key 2048
openssl req -new -key mbogning.key -out mbogning.csr -subj "/CN=mbogning/O=team1"

# Signature du certificat avec l’AC du cluster
sudo openssl x509 -req -in mbogning.csr \
    -CA /etc/kubernetes/pki/ca.crt \
    -CAkey /etc/kubernetes/pki/ca.key \
    -CAcreateserial \
    -out mbogning.crt -days 365

# Création d’un namespace dédié
kubectl create namespace production

# Création d’un rôle limitant les actions sur les pods
kubectl create role pod-reader --verb=get,list,watch --resource=pods --namespace=production
kubectl create rolebinding pod-reader-binding --role=pod-reader --user=mbogning --namespace=production

# Création d’un contexte kubeconfig pour l’utilisateur
kubectl config set-credentials mbogning \
    --client-certificate=mbogning.crt \
    --client-key=mbogning.key

kubectl config set-context mbogning-context \
    --cluster=kubernetes \
    --namespace=production \
    --user=mbogning

# Mise en place d’une NetworkPolicy restrictive par défaut
cat <<EOF | kubectl apply -f -
apiVersion: networking.k8s.io/v1
kind: NetworkPolicy
metadata:
  name: default-deny-ingress
  namespace: production
spec:
  podSelector: {}
  policyTypes:
  - Ingress
EOF
Avec cette approche, on obtient une base saine : droits minimaux côté API et réseau fermé par défaut côté ingress dans le namespace concerné.
6. Supervision et journalisation
La supervision et la journalisation sont ce qui vous fait gagner du temps quand un incident arrive. Sans métriques, on devine. Sans logs centralisés, on court après les informations. L’objectif ici est d’installer une stack complète mais raisonnable : Prometheus et Grafana pour les métriques, Loki et Promtail pour les logs.
On commence par installer Helm sur le nœud maître.
curl https://raw.githubusercontent.com/helm/helm/master/scripts/get-helm-3 | bash
helm version
Mise en place du monitoring avec Prometheus et Grafana
On ajoute le dépôt Helm, puis on déploie kube-prometheus-stack dans un namespace dédié.
helm repo add prometheus-community https://prometheus-community.github.io/helm-charts
helm repo update
kubectl create namespace monitoring

helm install prometheus prometheus-community/kube-prometheus-stack \
  --namespace monitoring \
  --set prometheusOperator.createCustomResource=true \
  --set grafana.enabled=true
Mise en place du logging avec Loki
On installe Loki et Promtail dans un namespace logging, puis on connecte Loki à Grafana.
helm repo add grafana https://grafana.github.io/helm-charts
helm repo update

kubectl create namespace logging

helm install loki grafana/loki-stack \
  --namespace logging \
  --set promtail.enabled=true \
  --set loki.persistence.enabled=true \
  --set loki.persistence.size=10Gi \
  --set grafana.enabled=false
Configuration de Grafana pour utiliser Loki comme source de données
cat <<EOF | kubectl apply -f -
apiVersion: v1
kind: ConfigMap
metadata:
  name: loki-datasource
  namespace: monitoring
  labels:
    grafana_datasource: "1"
data:
  loki-datasource.yaml: |-
    apiVersion: 1
    datasources:
    - name: Loki
      type: loki
      url: http://loki.logging.svc.cluster.local:3100
      access: proxy
      isDefault: false
EOF
kubectl rollout restart deployment -n monitoring prometheus-grafana
Accès aux interfaces de supervision
Pour un accès rapide en lab, le port-forward fait très bien le travail. Cela évite d’exposer des services inutilement.
kubectl port-forward -n monitoring svc/prometheus-grafana 3000:80
kubectl port-forward -n monitoring svc/prometheus-kube-prometheus-prometheus 9090:9090
Vous pouvez ensuite accéder à Grafana et Prometheus via les URLs suivantes.
Grafana se trouve à l’adresse http://localhost:3000 avec les identifiants admin et prom-operator. Prometheus se trouve à l’adresse http://localhost:9090.
Accès permanent via Ingress et HTTPS
Si vous souhaitez un accès durable, l’approche standard consiste à installer un contrôleur Ingress et cert-manager pour gérer TLS. Ici, on utilise NGINX et Let’s Encrypt.
Installation du contrôleur NGINX Ingress
helm repo add ingress-nginx https://kubernetes.github.io/ingress-nginx
helm repo update

helm install nginx-ingress ingress-nginx/ingress-nginx \
  --namespace ingress-nginx \
  --create-namespace \
  --set controller.service.type=NodePort \
  --set controller.service.nodePorts.http=30080 \
  --set controller.service.nodePorts.https=30443
Installation de cert-manager
helm repo add jetstack https://charts.jetstack.io
helm repo update

helm install cert-manager jetstack/cert-manager \
  --namespace cert-manager \
  --create-namespace \
  --set installCRDs=true
Création d’un ClusterIssuer Let’s Encrypt
cat <<EOF | kubectl apply -f -
apiVersion: cert-manager.io/v1
kind: ClusterIssuer
metadata:
  name: letsencrypt-prod
spec:
  acme:
    server: https://acme-v02.api.letsencrypt.org/directory
    email: admin@votredomaine.com
    privateKeySecretRef:
      name: letsencrypt-prod
    solvers:
    - http01:
        ingress:
          class: nginx
EOF
Règles Ingress pour Grafana et Prometheus
Ingress pour Grafana
cat <<-EOF | kubectl apply -f -
    apiVersion: networking.k8s.io/v1
    kind: Ingress
    metadata:
      name: grafana-ingress
      namespace: monitoring
      annotations:
        kubernetes.io/ingress.class: nginx
        nginx.ingress.kubernetes.io/ssl-redirect: "true"
        cert-manager.io/cluster-issuer: "letsencrypt-prod"
    spec:
      tls:
      - hosts:
        - grafana.cluster.local
        secretName: grafana-tls
      rules:
      - host: grafana.cluster.local
        http:
          paths:
          - path: /
            pathType: Prefix
            backend:
              service:
                name: prometheus-grafana
                port:
                  number: 80
EOF
Ingress pour Prometheus
cat <<EOF | kubectl apply -f -
apiVersion: networking.k8s.io/v1
kind: Ingress
metadata:
  name: prometheus-ingress
  namespace: monitoring
  annotations:
    kubernetes.io/ingress.class: nginx
    nginx.ingress.kubernetes.io/ssl-redirect: "true"
    cert-manager.io/cluster-issuer: "letsencrypt-prod"
spec:
  tls:
  - hosts:
    - prometheus.cluster.local
    secretName: prometheus-tls
  rules:
  - host: prometheus.cluster.local
    http:
      paths:
      - path: /
        pathType: Prefix
        backend:
          service:
            name: prometheus-kube-prometheus-prometheus
            port:
              number: 9090
EOF
Configuration DNS
Dans un lab, la solution la plus simple est de modifier le fichier /etc/hosts sur la machine cliente.
Copiez cette ligne
192.168.X.X grafana.cluster.local prometheus.cluster.local
Remplacez 192.168.X.X par l’adresse IP du nœud sur lequel le contrôleur Ingress est exposé.
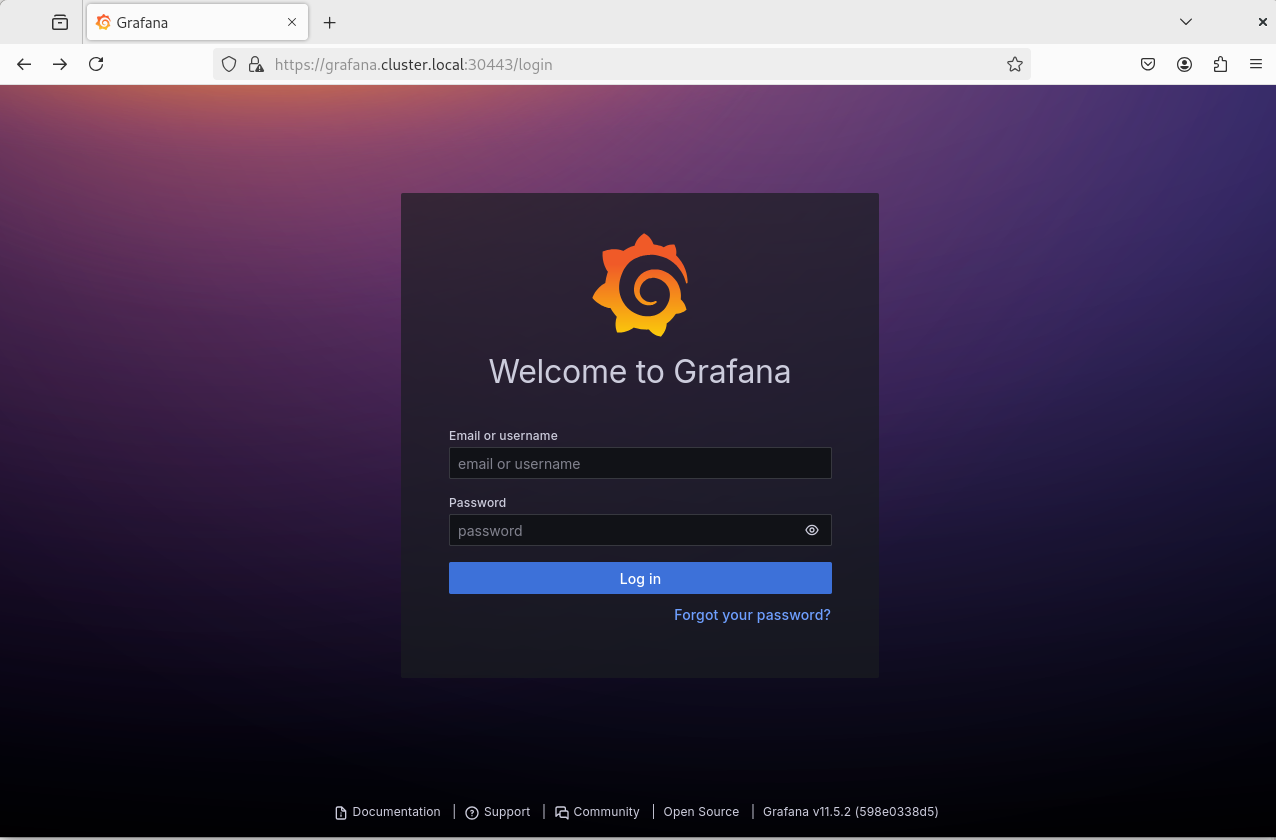
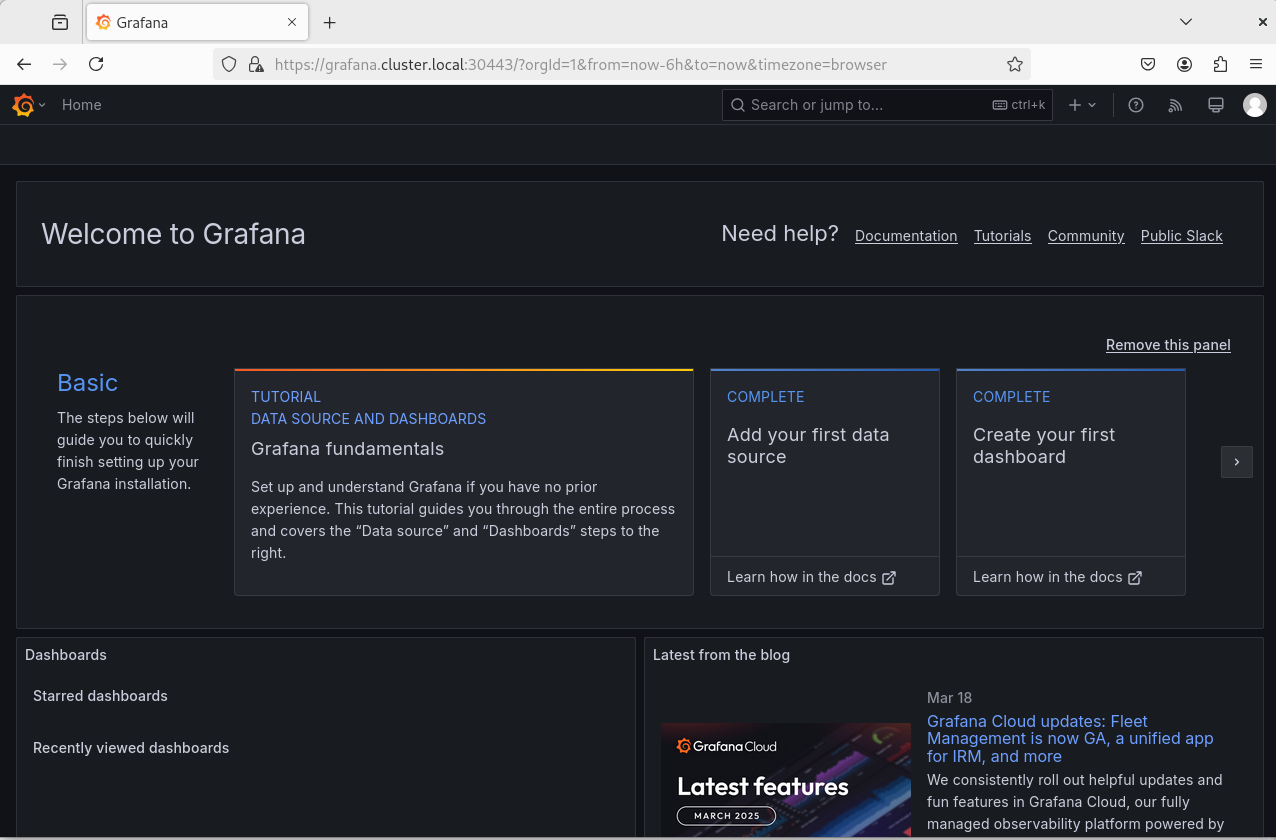
Accès Grafana
https://grafana.cluster.local:30443
Identifiants par défaut admin et prom-operator
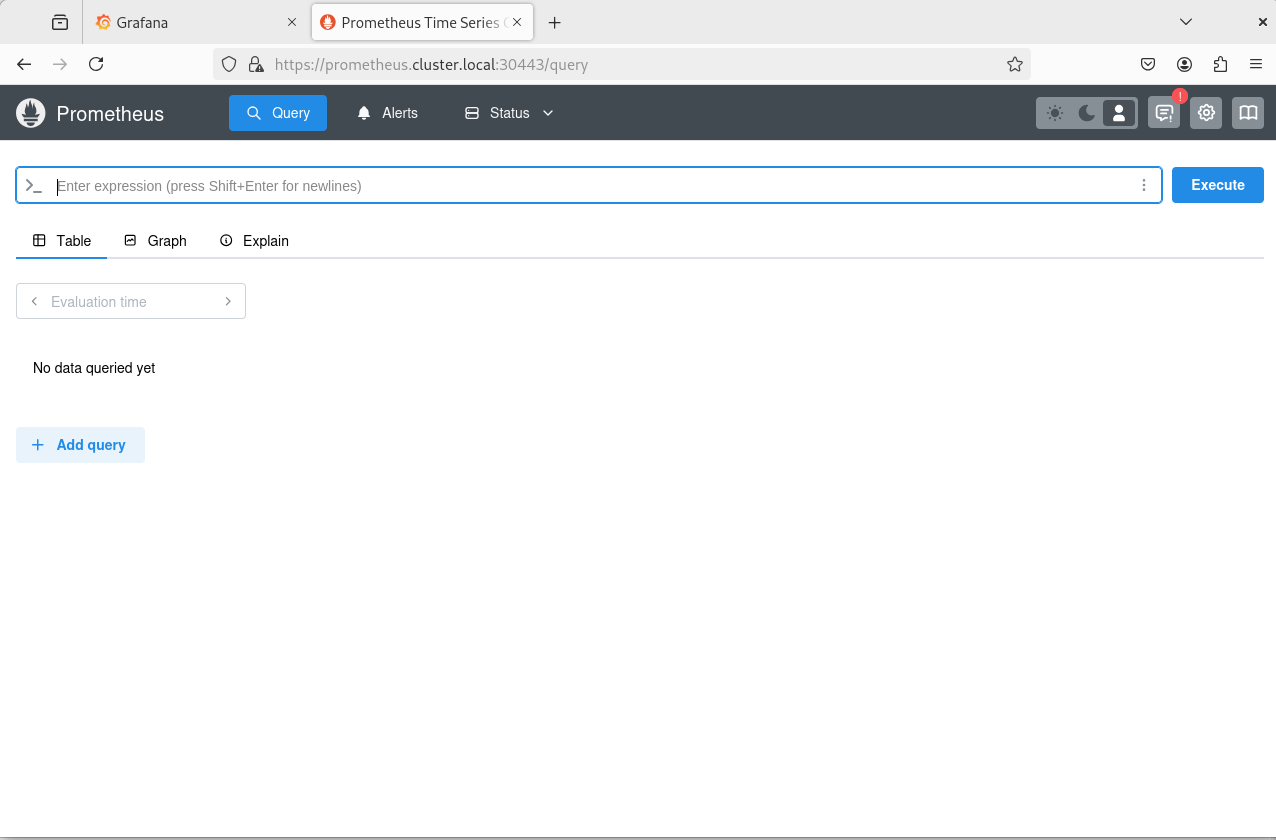
Accès Prometheus
https://prometheus.cluster.local:30443
7. Maintenance et sauvegarde
La sauvegarde d’etcd est le point qui sauve réellement un cluster quand quelque chose se passe mal. etcd contient l’état du cluster. Sans snapshot, une restauration complète devient beaucoup plus compliquée.
Sur le nœud maître, installez etcd-client, puis créez un snapshot.
sudo apt install -y etcd-client

sudo mkdir -p /backup
sudo ETCDCTL_API=3 etcdctl --endpoints=https://127.0.0.1:2379 \
  --cacert=/etc/kubernetes/pki/etcd/ca.crt \
  --cert=/etc/kubernetes/pki/etcd/server.crt \
  --key=/etc/kubernetes/pki/etcd/server.key \
  snapshot save /backup/etcd-snapshot-$(date +%Y%m%d).db
8. Validation et tests
Avant de considérer le cluster prêt, prenez l’habitude de valider l’état des composants et des namespaces critiques.
kubectl get nodes
kubectl get pods -A
kubectl get componentstatuses
Vérification des services de monitoring et de logging
kubectl get pods -n monitoring
kubectl get pods -n logging
Documentation
- Documentation officielle Kubernetes
- Documentation Calico
- Documentation Grafana et Prometheus
- Guide CIS Kubernetes Benchmark
Conclusion
Vous avez maintenant une base Kubernetes propre sous Debian 12, adaptée à un usage sérieux.
Vous avez préparé le système, installé un runtime stable, initialisé le cluster, configuré Calico, ajouté des contrôles d’accès, fermé le réseau par défaut sur un namespace, mis en place la supervision et les logs, puis prévu une sauvegarde etcd.
À partir de là, vous pouvez aller plus loin sans repartir de zéro. Vous pouvez durcir selon CIS, introduire GitOps, ajouter de l’alerting, ou faire évoluer l’architecture vers un control plane en haute disponibilité.